Table Of Contents
- What Is Performance Analytics?
- What Are The Major Key Features Of Performance Analytics?
- · Historical Trend Analysis
- · Real-Time Dashboards
- · Automated Data Collection
- · KPIs And Metrics
- Standard Reporting vs. Performance Analytics
- How Can You Get Started With This?
- 1. Define Your KPIs
- 2. Set Up Dashboards
- 3. Automate Data Collection
- 4. Analyze And Act
- The Great Debate: Real-Time Insights vs. Past Snapshots
- What Are The Best Practices Of Performance Analytics?
Why 90% Of Businesses Fail To Scale (And How Performance Analytics Fixes It Instantly)?
Performance Analytics helps businesses track goals and improve their operations.
It automatically collects live updates and predicts future trends rather than only looking at historical data.
Teams can quickly fix problems, smooth out daily tasks, and build easy-to-read dashboards tailored to different job roles by connecting past and present data.
Learning how this tool works helps you move from basic reporting to smart, forward-looking planning.
This guide shows how Performance Analytics automates data collection, boosts daily performance, and gives your team the exact insights they need to succeed.
What Is Performance Analytics?

Simply put, it is an advanced tracking and visual tool built right into these tools.
It lets you easily check and measure your main goals, while automatically gathering data in real time. Plus, you get to build super easy-to-read dashboards.
Furthermore, this tool does not just look backward. It actually helps you spot future trends, boost automatic tasks, and upgrade your self-service options.
You can easily forecast what is coming next, since it connects your past and present workplace data.
As a result, you can quickly fix annoying bottlenecks and smooth out your daily processes.
What Are The Major Key Features Of Performance Analytics?
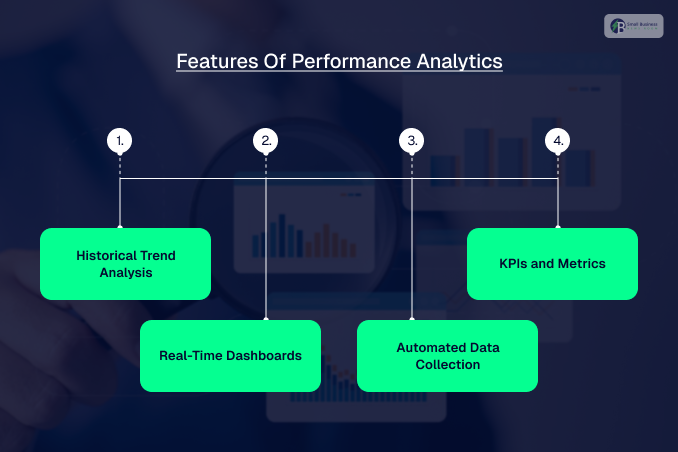
Let’s look at the cool features that make this tool a must-have for your team. From tracking your history to building pretty dashboards, performance analytics has everything you need.
Here is how it helps you win every day.
· Historical Trend Analysis
First, it tracks past trends. By looking back, you can see how your team has improved and predict future success.
This handy data helps you set realistic targets, fix issues early, and make smart, strategic plans for your business safely.
· Real-Time Dashboards
Next, you get real-time dashboards. These fun, customizable visuals update instantly to fit your exact role.
Thanks to helpful filters and deep drill-downs, you can easily click through complex data and find the exact answers you need right away.
· Automated Data Collection
Additionally, it automates data collection across these analytics. This saves a huge amount of time and prevents manual errors.
Since it gathers everything automatically, you can easily dive deep into the records to see what is truly driving your performance daily now.
· KPIs And Metrics
Finally, it simplifies tracking KPIs. It helps you pick and organize the metrics that matter most to your business goals.
By using these clear benchmarks, you can easily judge your success and drive better daily decisions for your whole team.
Standard Reporting vs. Performance Analytics
A common point of confusion is the actual difference between standard reporting and performance analytics.
While both deal with data, they do two completely different jobs for your team.
To put it simply, standard reporting is like looking through your rearview mirror. It gives you historical snapshots and static summaries of what already happened.
This is incredibly useful when you need to handle compliance, run audits, or review past performance to see how a project went.
On the flip side, performance analytics is like looking through your front windshield with a great GPS navigation system.
It focuses entirely on the present and the future by tracking your data in real time.
Instead of just showing you old numbers, it uses trend analysis and predictive modeling to help you spot sneaky bottlenecks before they happen.
Quick Choice Guide
- Choose Performance Analytics to: Monitor live data streams, interact with dynamic dashboards, and continuously track automated KPIs for fast daily decisions.
- Choose Traditional Reporting to: Print static financial documents, export data lists for documentation, or review historical facts for a quarterly planning session.
How Can You Get Started With This?
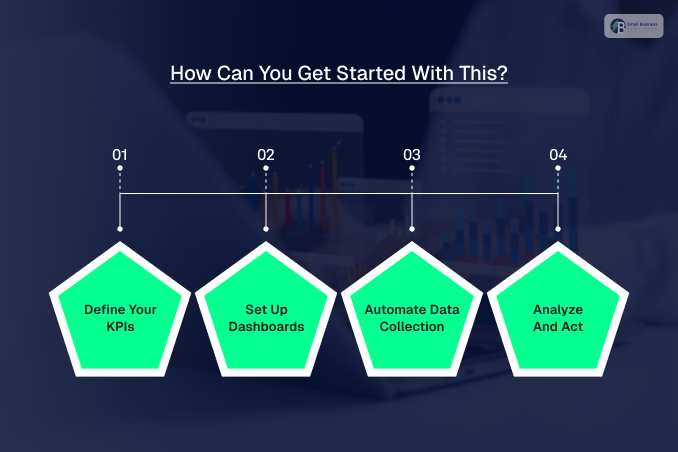
Setting up this tool is actually super easy when you follow a few basic steps. Here is a simple guide to help you launch your platform today.
1. Define Your KPIs
First, define your KPIs. Sit down with your team to pick the key metrics that align with your big business goals.
Talking to different departments ensures your chosen metrics are highly useful, relevant, and comprehensive for everyone involved.
2. Set Up Dashboards
Next, set up your dashboards. Customize them with pretty charts so they match different job roles perfectly.
For instance, bosses might want quick summaries, while your daily operational staff will need deep, clickable data to make decisions.
3. Automate Data Collection
Then, automate your data collection. Use the built-in system to keep your charts up to date without manual work.
This clever platform also integrates smoothly with external tools, making your entire data portfolio much stronger and more accurate.
4. Analyze And Act
Finally, analyze and act. Regularly check your fresh stats to spot trends and fix sneaky problems early.
Diving deep into data helps you identify the root causes of issues so you can implement the best fixes.
You May Also Like: Startup Accounting Secrets: The VC Blueprint 90% Of Founders Fail To Use
The Great Debate: Real-Time Insights vs. Past Snapshots
A question I get asked all the time is: what is the actual difference between standard reporting and performance analytics?
It is super easy to mix them up since they both deal with data, but they actually do two completely different jobs for your team.
To put it simply, standard reporting is like looking through your rearview mirror. It gives you historical snapshots and static summaries of what already happened.
This is incredibly useful when you need to handle compliance, run audits, or review past performance to see how a project went.
On the flip side, performance analytics is like looking through your front windshield with a great GPS.
It focuses entirely on the present and the future by tracking your data in real time.
Instead of just showing you old numbers, it uses trend analysis and predictive modeling to help you spot sneaky bottlenecks before they happen.
So, when should you use each one? Go with performance analytics if you want to:
- Monitor live data,
- Play around with interactive dashboards,
- Continuously track your KPIs.
This can help you to make fast, daily decisions.
Traditional reporting is your best friend if you just need to print out static documents for documentation or review historical facts for a strategic planning session.
What Are The Best Practices Of Performance Analytics?
When you use it right, performance analytics can offer you sharp insights into how your business is really doing.
Here are some of the finest methods to utilize the most out of this robust software:
- Prioritize Your Resources: Focus strictly on the primary domains where data has the greatest day-to-day impact.
- Put into Continual Service Improvement: Habitually monitor and modify your tracking methods to remain entirely relevant.
- Enhance Your Automation: Arrange for automated data capture to save time and eliminate human error.
- Facilitate Self-Service for Better User Experiences: Enable users to access their dashboard directly so they can check their own stats.
- Quantify Both Leading and Lagging Indicators: Monitoring historical data and future projections will help you better understand the situation.
- Make Regular Updates to Your Data: Frequently review your data so as to keep the charts up to date and uncover hidden gems.
- Bring Performance Analytics on Board One at a Time: Use a few key metrics initially to avoid overwhelming your team.
- Spend Some Time with Exploration, Refinement, and Customization: Personalize your reports and graphs to fit your way of working perfectly.
Additional Resource: The Beaconsoft Latest Tech Info Guide: Master Modern Tech And Grow Your Business Fast!