Table Of Contents
- TAM SAM SOM: What Does This Mean?
- How Can You Calculate Tam For The Business?
- Method 1: The Top-Down Approach
- Method 2: The Bottom-Up Approach
- Where To Find Reliable Data?
- Common Pitfalls To Avoid
- Tam Sam Som: The Differences
- Reading The Vital Signs Of Your Business
- · Spotting Overinvestment
- · Spotting Market Saturation
- · The Investor Tell
- How To Realistically Estimate Sam And Som?
- How To Calculate Your SAM (Serviceable Addressable Market)?
- · Geographic Boundaries
- · Target Segment Realities
- · Technical Infrastructure
- How To Calculate Your SOM (Serviceable Obtainable Market)?
- Why Overestimating Hurts Your Business?
- How To Pressure-Test Your Numbers?
Why 90% Of Startups Fail At Market Sizing (And How This 3-Step Tam Sam Som Framework Changes Everything)
A simple business has no future without a market. You need to understand your market size to set your goals, build the right products, and pitch to investors successfully.
Just take a look at Facebook. When it started, social media was completely unproven.
Facebook had to prove an audience existed. Investors bought into their early data about college students, and the rest is history.
So, how can you find these numbers for your own startup? In this blog, we will look at three letters: Tam Sam Som.
Market sizing means estimating your potential revenue. By using Tam Sam Som, you can pinpoint your exact target audience and guess your future market share.
Consequently, this helps you allocate your resources wisely, set realistic goals, and make smart choices for growth.
TAM SAM SOM: What Does This Mean?

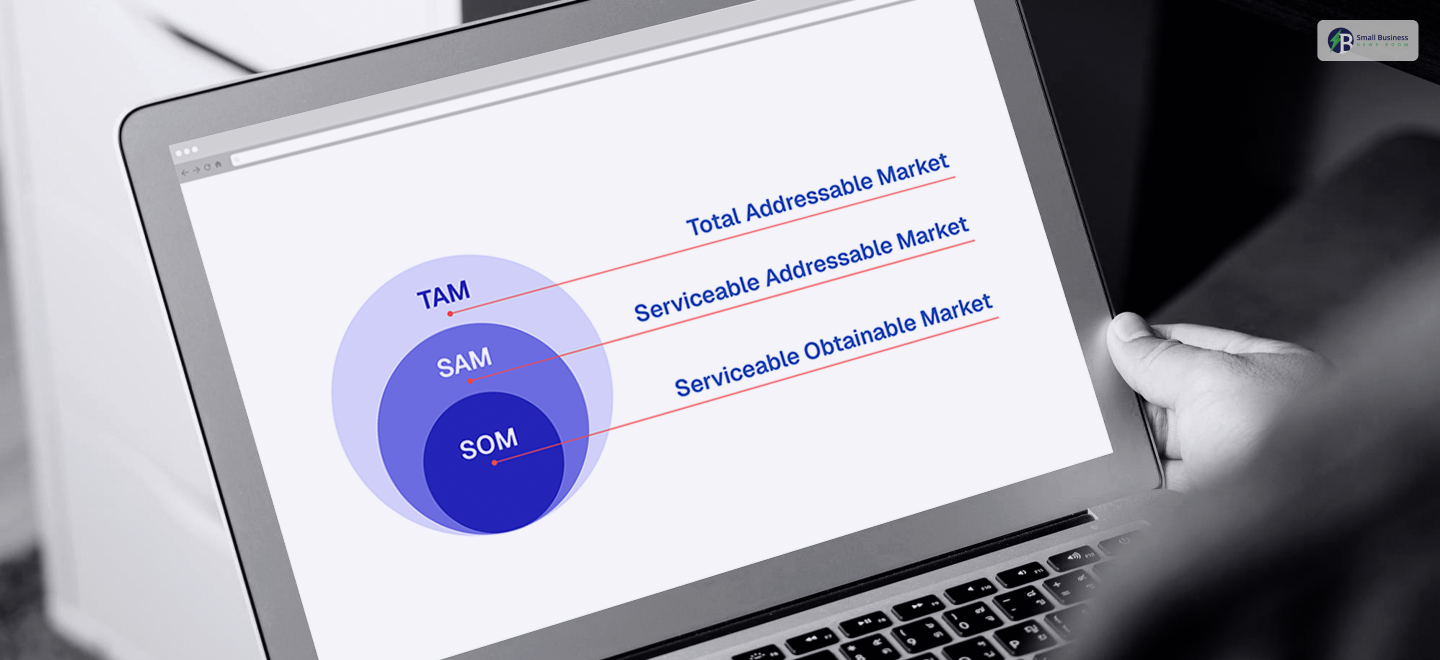
Now, let’s break down what TAM SAM SOM actually means. Imagine a giant dartboard with three rings.
First, the biggest outer ring is TAM. This stands for Total Addressable Market.
Essentially, it is the total amount of money you could make if you had absolutely zero competition and every single potential customer bought your product.
It is the biggest possible dream. Next, the middle ring is SAM, or Serviceable Addressable Market.
Furthermore, since you cannot serve the whole world, SAM is the realistic slice of that giant pie you can actually reach with your current setup and location.
Finally, the bullseye in the center is SOM. This is your Serviceable Obtainable Market.
It represents the actual number of customers you can realistically win over right now, considering your current budget and competition.
Naturally, these three rings fit inside one another, with TAM as the foundation. So, let’s start by calculating that first!
How Can You Calculate Tam For The Business?

If you are planning to calculate the TAM from your Tam Sam Som puzzle, there are two specific methods you can use from.
This is more like looking at the market from a bird’s-eye view or building it up brick by brick.
So, let’s dive into how both approaches work using real numbers so you can choose the best fit for your business.
Method 1: The Top-Down Approach
This method is quick and straightforward because it starts with giant industry reports. This also helps to narrow things down to your specific niche.
- Start with the Big Picture: Begin with what you are aiming for. The bigger picture can help you understand what you are aiming for.
- Apply Your Filters: Secondly, you need to carve out your specific space.
Research shows that they make up 35% of that total spending. You use that percentage if your new software targets only small-sized and medium-sized businesses.
- The Calculation: You take the €8 billion and multiply it by 35%.
- The Result: Your TAM comes out to approximately €2.8 billion.
Keep in mind: This method is fast. However, it heavily depends on the third-party reports’ accuracy. This can sometimes be outdated or slightly inaccurate.
Method 2: The Bottom-Up Approach
This method takes a bit more effort. However, it gives highly reliable results. Why?
Well, it anchors your estimates in your actual product pricing and real customer numbers.
- Identify Your Price: Let’s say you sell a great project management tool for €100 per user each month.
- Count Your Potential Customers: Through your research, you identify the total number of companies in your target market.
- Estimate the Scale: On average, each of these companies has 25 employees who would actually need to use your tool.
- Math: You multiply the pieces together across a full year: 50,000 companies × 25 users × €100 per month × 12 months.
- The Result: Your TAM is safely calculated at €1.5 billion.
Where To Find Reliable Data?
The quality of the data matters a lot for getting your Tam Sam Som numbers right. You just need to avoid sketchy blog posts and stick to trustworthy data sources.
- Government Statistics Offices can greatly help with overall business counts and regional demographics.
- Industry Associations can be ideal for sector-specific insights and trade data.
- Well-known Research Firms, such as Gartner and IDC, have strong reputations and provide market sizing data with high credibility.
Common Pitfalls To Avoid
Finally, protect your business logic from early mistakes. Investors will spot these immediately, so keep an eye out for these common traps:
- Double-Counting Segments
You need to ensure you are not counting the same group of customers twice under different categories.
- Ignoring Market Maturity
Historical data will wildly overestimate your potential if you are entering a mature, declining market.
Conversely, if you are creating a brand-new space where solutions barely exist yet, the current spending data can underestimate the true value of yours.
- Using Stale Data
Now, we all know that the markets shift fast. Thus, you always need to validate your assumptions.
For this, you can use multiple recent data sources and be completely transparent about the drawbacks as well.
You Can Also Check: Can I Start A Baby Food Trading Business In Dubai?
Tam Sam Som: The Differences
Let’s map out how these three metrics stack up against each other, to help your readers easily see the breakdown.
You can consider this: Tam Sam Som is a funnel that moves from a big, beautiful dream down to your immediate game plan.
Quick Comparison Table
| Metric | What It Stands For | The Core Question It Answers | Real-World Filters Applied | Tech Company Example (AI Support Software) |
| TAM | Total Addressable Market | What is the total global spending if everyone bought this type of solution? | None. It completely ignores geography, your business model, and competition. | €15 Billion (Total global spending on all customer service software) |
| SAM | Serviceable Addressable Market | Which portion of that big market can we actually reach with our current setup? | Geography, language support, product features, and target business size. | €2 Billion (Mid-market companies from Western Europe for the sales presence) |
| SOM | Serviceable Obtainable Market | What share of the market can we realistically win over the next few years? | Budget limits, current sales staff, and local, active competitors. | €50 Million (A realistic 2.5% market penetration over the next 3 years) |
Reading The Vital Signs Of Your Business
Understanding the relationship between the numbers helps you allocate your budget and pitch to investors with total clarity:
· Spotting Overinvestment
If your short-term goal (SOM) is €50 million, but you are hiring a giant sales team built to handle €200 million, you are spending money way too fast.
· Spotting Market Saturation
If your current revenue is getting very close to your SAM, it means you are running out of room to grow.
Moreover, you need to expand to new regions or add new features before pouring more money into marketing.
· The Investor Tell
Investors look closely at the gaps among these metrics. TAM and SAM gap tells them you have massive room to scale up later.
Meanwhile, a healthy gap between SAM and SOM shows you have plenty of room to run right now before needing to pivot.
Related Article For You: Innovative Small Business Ideas To Launch In 2026: A Comprehensive Guide
How To Realistically Estimate Sam And Som?

Now that we have nailed down TAM, let’s look at how to get real and honest with your SAM and SOM numbers.
Calculating these metrics is not about daydreaming; it is about looking at your current boundaries and capabilities.
Let’s break down how to calculate them using real-world filters and math.
How To Calculate Your SAM (Serviceable Addressable Market)?
To find your SAM, you take your giant TAM figure and strip away everything you cannot realistically reach right now. You need to apply three strict filters:
· Geographic Boundaries
Where can you legally and practically operate?
For example, if a SaaS company has a global TAM of €10 billion, their team only speaks Dutch, English, and German, they cannot sell to Japan or Brazil yet.
By filtering for the Benelux, Ireland, the UK, Austria, Switzerland, and Germany, their SAM realistically drops to €3 billion.
· Target Segment Realities
You need to understand who your product is actually built for.
If your software is designed perfectly for mid-sized companies with 50 to 500 employees, you must completely exclude the giant enterprise companies.
They will not buy from you because you lack the massive features they require.
· Technical Infrastructure
You must filter out any potential customers who lack that infrastructure if your product requires a specific type of tech setup to work.
How To Calculate Your SOM (Serviceable Obtainable Market)?
Your SOM is the actual slice of the market you can win over the next 1 to 3 years. Here are two practical ways to calculate it using real data:
Method A: The Sales Capacity Math (Bottom-Up)
Look directly at what your current sales team can handle.
- Year 1 Capacity: Your team can realistically close to 50 customers.
- Year 2 Capacity: With a bit of growth, they close to 80 customers.
- Year 3 Capacity: They hit their stride and close to 120 customers.
- Math: Total customers over 3 years (250) × an average contract value of € 50,000.
- The Result: Your 3-year SOM is €12.5 million.
Method B: Market Penetration Percentage
Successful startups grow more than 5% to 10% of their SAM in their early years.
- The Calculation: Let’s say you have a SAM of €500 million and conservatively estimate that you can capture just 3%. And the SOM is around €15 million.
- Tip: Keep your percentage low if you are entering a market crowded with intense competition or if your budget for customer acquisition is small.
Why Overestimating Hurts Your Business?
It is always better to be conservative than wildly optimistic. Here is why inflating your Tam Sam Som data backfires:
- Premature Burn Rate
There have been tech companies with a €10 million-worth project in two years’ revenue based on an exaggerated SOM.
They went out and hired a huge team, but only brought in €3 million. This forced them into painful downsizing and layoffs.
- Loss of Credibility
Investors are smart. If your numbers are unrealistic, you will instantly lose their trust during a pitch.
How To Pressure-Test Your Numbers?
Before you publish your blog post or finalize your pitch deck, always double-check your logic:
Firstly, you need to compare your projections against the actual performance of similar companies.
Secondly, you need to talk to industry experts who know the target market inside and out.
Lastly, you need to build three financial paths: a conservative, a moderate, and an optimistic. Always base your actual business planning on the conservative one!